Mission Statement
To search, learn, follow and share significant discoveries of the financial and economic market cycles for educational purposes all for the public welfare. The goal is to ask questions and share knowledge — from R.N. Elliott’s Wave principle, A.J. Frost and Robert Prechter’s application of Elliott Wave, to Glenn Neely’s Neowave theory.
FEATURED ARTICLE
An Elliott Wave viewpoint: An Intriguing Long-Term Wave Forecast of the U.S. Stock Market
Published 5/26/2020
by Patty Jackson (Updated 2/25/24)
Investors looking to profit from the market look to Elliott Wave Theory for insight into market trends. This method of technical analysis has aided investors in understanding price movements in the financial market. Developed by Ralph Nelson Elliott, it observes recurring fractal wave patterns to identify stock price movements and consumer behavior. This method of understanding market trend gained much notoriety in 1935 with Elliott’s stock market predictions from portfolio managers, traders, and private investors. Since then, some technical analysts profit from identifying wave patterns in the stock market using Elliott Wave Theory. Other analysts have developed indicators inspired by the Elliott Wave principle, such as the Elliott Wave Oscillator Chart and NEo Wave Patterns. While other analysts have used Elliott Wave theory to make short and long-term stock market predictions to better understand the market cycle.
A 72-Year Long-Term Wave Forecast from 1988
In 1988, the Foundation for the Study of Cycles published a 72-year long-term wave forecast. The article, written by Elliott Wave forecaster, Glenn Neely claimed that the Dow Jones will reach 100,000 by the year 2060. Neely stated, “For those of you who find a 100,000 Dow incomprehensible, consider that the market, from my predicted low of 0.30 up to the 1987 high of approximately 2700, has increased in value almost one million percent in a little over 200 years. A move from 2700 to 100,000 is only 4900%. The analysis allows 70 years for this to take place. Thus, a move to 100,000 in 70 years is highly plausible in comparison to the historical record.” (Cycles Magazine, September/October 1988 “Elliott Wave” issue.) At the time, in 1988, the Dow hovered around 1,900. Since then, as Neely predicted, the U.S. stock market continues to edge upward. The Dow hit 30,000 in November 2020, 35,000 in July 2021 and 39,000 in February 2024. How this long-term forecast plays out will be interesting to witness for the next few decades.
Editor’s note: We’ve received numerous request for a copy of Glenn Neely’s article published in the Foundation for the Study of Cycles. A printed version of the article can be found in the Appendix of Glenn Neely’s book, Mastering Elliott Wave. With permission from the author, the article is posted below…
ARTICLE SOURCES
- Glenn Neely, “The Future Course of the U.S. Stock Market, An Elliott Wave Viewpoint“, Foundation for the Study of Cycles, September/October, 1988, 217-233.
- Neely, Glenn; Hall, Eric (1990-04-01). Mastering Elliott Wave: Presenting the Neely Method: The First Scientific, Objective Approach to Market Forecasting with the Elliott Wave Theory (2nd ed.). Brightwaters, NY: Windsor Books. p. 1. ISBN 978-0-930233-44-0
MARKET CYCLES
The Future Course of the U.S. Stock Market
An Elliott Wave Viewpoint
by Glenn Neely
THE GROUND WORK: What Does the Theory Furnish the Technician?
The Elliott Wave Theory furnishes a framework within which to organize a market’s price action into specific formations over any time period. All market action under the Wave Theory breaks down into two major categories:
1.Action with the larger trend.
2.Action against the larger trend
1. Simplistically, price action moving with the trend (of the next larger magnitude) will be constructed differently from that going against the trend. The majority of the price movement in the direction of the trend will be constructed of five smaller phases or segments (see Figure 1a). Broadly speaking, this type of price action is defined as Impulsive (in nature). If a pattern on the largest scale possible is Impulsive, it cannot be completely retraced until at least one more comparable Impulse wave (in the same direction as the first) is completed.
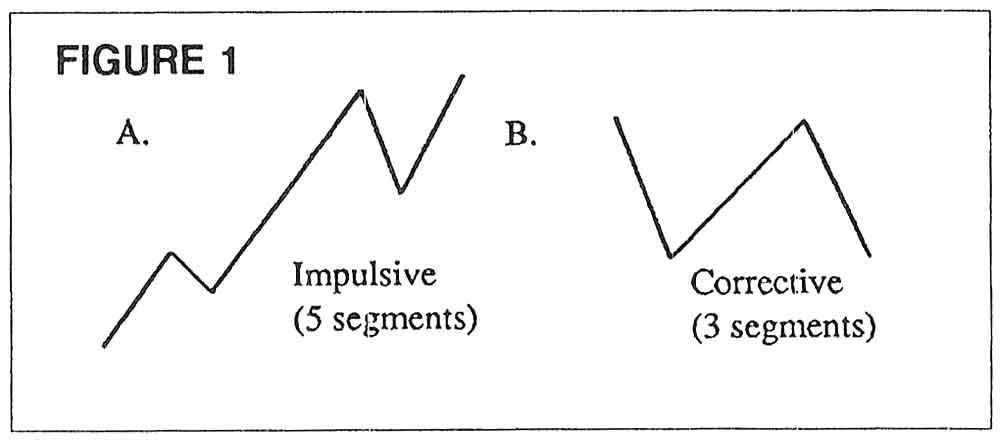
2. Price action that moves in the opposite direction of the next larger trend is usually constructed of three smaller segments (see Figure 1b). This type of action is classified as Corrective (in nature). When price action is correctively constructed, future price action will usually retrace the Correction completely.
DYNAMIC CONCEPTS
For anyone who has tried, it is usually futile to linearly extrapolate current market or economic action into the future. Ask any corporation how well they predicted their own growth and future demand for their products based on previous years’ data. Usually their forecasts are significantly different from the final results.
History demonstrates that man’s progress is dynamic and logarithmic, not static or linear. Look at the historical, logarithmic chart on the U.S. stock market dating back to 1789 (see Figure 2, courtesy Foundation for the Study of Cycles). Sometimes advances occur in spurts, followed by consolidation phases that last for long periods of time. Then again, occasionally the reverse happens. This reveals that market’s dynamic behavior. The relatively consistent advance on a log scale for the last 200-plus years demonstrates the logarithmic nature of economic progress.
The Wave Theory supplies the analyst with a forecasting tool that is best implemented on a logarithmic basis. Furthermore, it allows for dynamic development contained within a fractal process. Fractals are part of a relatively new and burgeoning area of science called “Chaos.” Chaos deals with the multifarious character of turbulence and the complex geometry of propagation in nature. The association with fractals comes from the Wave Theory’s flexibility within a structured format. Repetition of Elliott patterns occurs over and over, each time with a slight variation or new twist. These repetitive patterns can then be combined to create larger patterns of appearance or design similar to the smaller structures. For example, if you examined Figure 1a under a microscope, the long center segment would break down into a pattern which might closely represent the appearance of the entire diagram.
With the introduction of Chaos, science is now able to explain what has, heretofore, been considered random behavior. The numerous similarities between the Wave Theory and Chaos science further validates the applicability of the Wave Theory to the once-thought “random” action of stock and commodity prices.
PRICE ACTION LIMITATIONS
Elliott Wave price patterns force the analyst into specific conclusions. The conclusions are not based on emotion or opinion, but are forced upon the analyst through objective and detailed study. Predictions are derived from the highest probability outcome founded on historical precedent. When applied correctly, the Theory can help the analyst produce short- and long-term forecasts which are, occasionally, pinpoint accurate.
THE ANALYSIS: Implications of the Long-Term Data

A quick overview of the long-term price activity (Figure 2) immediately brings to bear one important fact. The start of the advance, which has been in progress for at least 200 years, cannot be coincident with the beginning of the currently available long-term data series. Remember, the Wave Theory is a natural law of progression. Its reflections of societal development are present whether someone is around to register them or not. It is only logical to assume that the recording of data would not necessarily coincide with the advent of a multi-century advance.
DETERMINING AN HISTORICAL LOW FOR THE LONG-TERM DATA SERIES
The data we are working with starts in 1789. Obviously, this country was inhabited and growing before that time, so there was economic activity taking place, albeit unrecorded. A quick glance at the start of the data series reveals that the price action was initially drifting sideways for several decades. This is not the way a trend (Impulsive action) begins. The commencement of a trend (under the Wave Theory) must begin with Impulsive action – action that is only minimally retraced by later activity. You can see that the market drifted back and forth many times before finally advancing in the early 1800s. The implies the 20-plus-year consolidation must have been a Corrective phase following an Impulse (trending) pattern.
Methodically administering a host of subtle Elliott Wave techniques, I deduced that the best point of inception for the last 200-plus year advance was 0.30 (i.e., 30 cents). The market was most likely at that level around the year 1765 +/- 10 years. The following observations helped me to arrive at the above conclusions:
1. For the last 200-plus years, the U.S. economy (based on stock market averages) has been advancing at a great clip (approx. 100,000% since the official projected low around 2.51 in 1789). Based on this evidence, it is safe to assume that the U.S. stock market has been in a trending pattern (Impulsion) since that time or before. According to R.N. Elliott, an Impulse wave should contain an Extension (one advance that is significantly longer than the other advances). Since 1789, there has not been an Extended wave (see Figure 2); the second and third advance are about equal, and the first advance is much smaller. This is a pivotal observation. If the nature of the advance since the 1700s is to be considered Impulsive, there must eventually be one advancing wave that is substantially longer than the others. Resting solely on that fact, it is imperative to assume the multi-century economic expansion, probably beginning with the colonization of North America, has not ended.
2. The large middle section (second advance) of the last 200-year advance (1860 to 1929) is Corrective in nature. Impulse patterns are known for their acceleration phases. These usually occur toward the center of the longest wave. It is immediately evident that the advance from 1860 to the high in 1929 does not exhibit any such acceleration phase toward its center. Actually, the reverse is true; the second advance consolidates toward its center (see Figure 2). This is basically impossible in an Impulse pattern.
3. From 1940 to 1960, the U.S. experienced the largest, most persistent, least retraced stock market advance in recorded history (see Figure 2). If a market starts to increase its rate of acceleration after prolonged periods of slower action (relatively speaking), it is an excellent indication that an Extended wave is getting underway. The strongest argument for an extension beginning in 1949 is the gradually increasing market volume over the last forty years as the market continues to make new highs. Volume, as a rule, increases toward the center of an Extended wave, especially if that extension is a third wave.
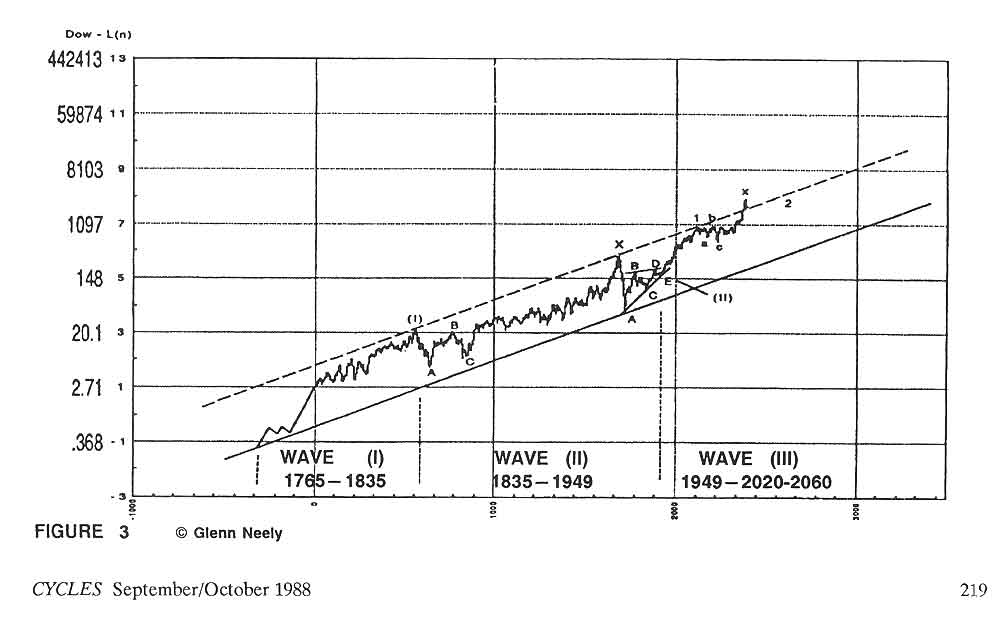
4. A base trend line can aid in the identification of Corrective patterns of the same degree (i.e., patterns within the same Elliott formation). When employing this technique on the available data (see Figure 4), the trend line runs across the low in 1860 and 1932. There is no doubt that a Flat pattern (with a C-wave failure), starting in 1835, concluded at the low in 1860. That Flat pattern contained the typical three segments common to most corrections. The complexity of the Flat correction is far too great to be directly relatable to the virtually vertical decline which started in 1929 and finished in 1932. If the two points identified by the trend line are to have any relation, the Corrective period after 1929 must have been more complex and time consuming than is immediately apparent. During Elliott’s lifetime, he interpreted the price action from 1929 to about 1949 as a 21-year contraction phase (a Triangle, using Elliott’s terminology; see Figure 4). Once a 21-year Triangle is included in the price structure, there is better time corroboration between the two corrective phases along the base trendline (i.e., a 25-year Flat Correction from 1835 to 1860, and a 21-year Triangle).
THE LONG-TERM WAVE COUNT
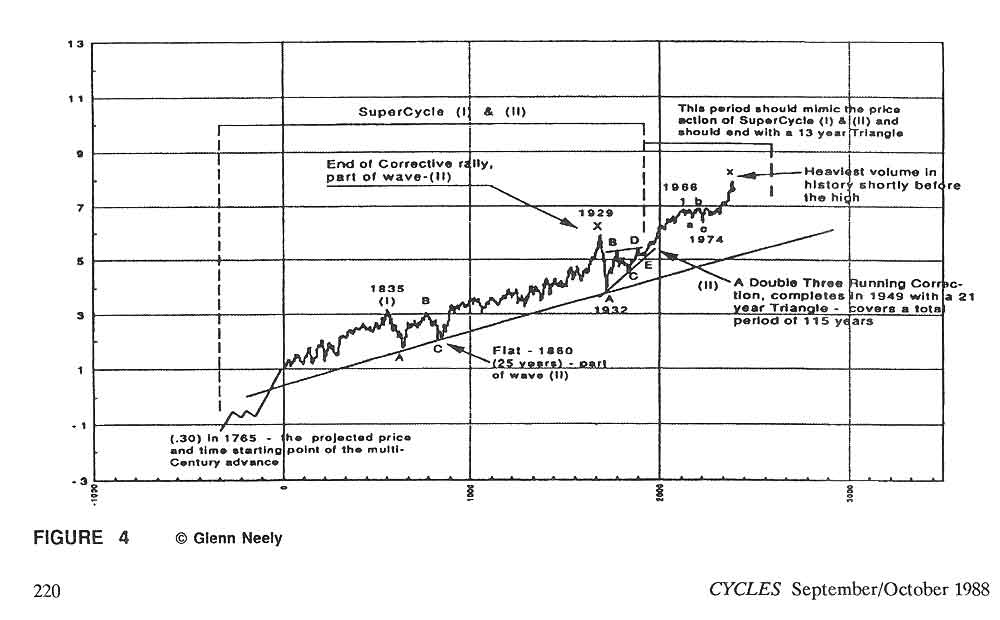
The previous analysis enabled me to determine that the historical starting point for the U.S. stock market was most likely 30 cents in 1765 (+/- 10 years)! From this it was possible to place a long-term wave count on the historical data series. The results displayed in Figure 3 are:
Wave (I) 1765 to 1835
Wave (II) 1835 to 1949
Wave (III) 1949 to 2020-2060
The following analysis details the placement of the above wave count:
1. With a starting level of 0.30 (around 1765) established, the advance to 1835 now becomes a very clear Impulse pattern with a long (extended) first wave (see Figure 4). The 1835 high would be labeled wave (I) of SuperCycle degree.
2. It has already been decided that there was a Flat correction from 1835 to 1860, which was part of SuperCycle wave (II); and that the advance from 1860 to 1929, based on the highest probabilities, was corrective in nature. If that rally had been Impulsive, the low in 1860 would have been the end of wave (II) of SuperCycle degree. Since the advance is Corrective, the rally from 1860 to 1929 must also be part of SuperCycle wave (II) (see Figure 4).
When a second wave contains a Corrective advance of that magnitude (1860-1929), the second advance must be some variation of Running Correction. The most common form of Running Correction is the Double Three. A Double Three typically concludes with a Non-Limiting Triangle. This provides a perfect explanation for the 21-year Triangle between 1929 and 1949 that Elliott described. That Triangle terminated a 115-year corrective phase which finalized SuperCycle wave (II) (beginning in 1835; see Figure 4).
3. Wave-3 started in 1949 and is still unfolding. The powerful implications of a second-wave Running Correction guarantee that the third wave will be the longest wave of this multi-century advance. When the third wave is the longest wave of a pattern, it will generally subdivide more than wave-1 or wave-5. As this subdivision occurs, a smaller five-wave move (Impulse pattern) will become evident within the third wave. Inside this larger third wave, wave-1 and 2 will usually mimic the price action of the larger first and second wave. (In this case, the larger first wave begins approximately 1765, and the second wave ends in 1949.) Applying this concept, we can anticipate that the advance from 1949 to some future date will look similar to the price action from 1765 to 1949 (see Figure 4).
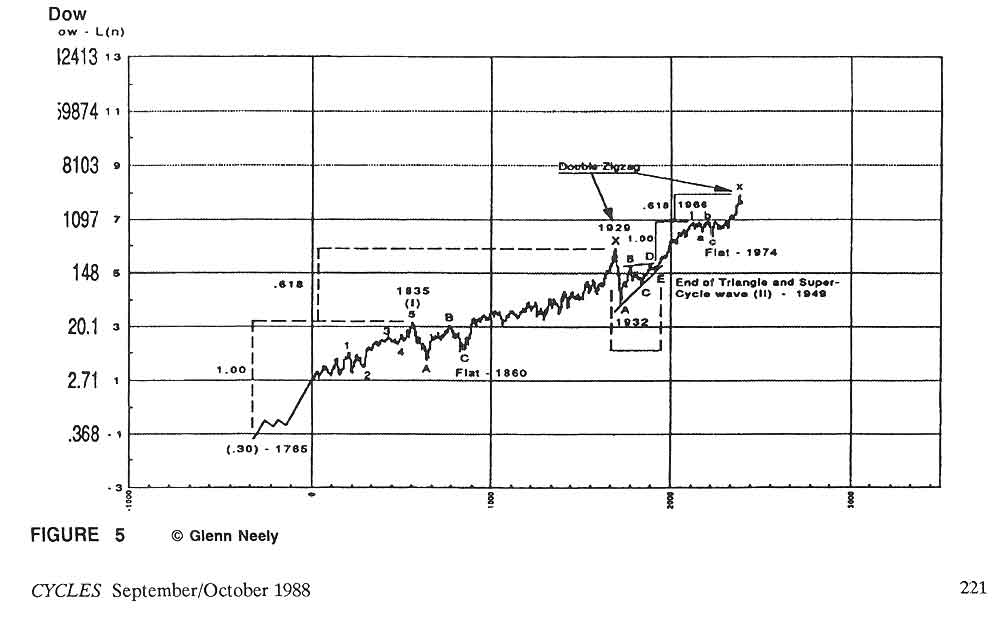
From 1949, an Impulse wave is present that concludes at the high in 1966. That high is wave-1 of Cycle degree. The sideward action from 1966 until 1974 would complete a three-phase Flat correction. It was from the 1974 low that the latest “bull market” began in stocks. Once again, just like the period from 1860 to 1929, the 1980s “bull” market was Corrective in nature (see Figure 5). In addition, all of the action since the high in 1987 is unfolding into Corrective patterns.
The remarkable parallelism between Supercycle wave (I) and (II) and the latest Cycle wave-1 and wave-2 (Cycle 2 is still unfolding) cannot be discarded. These additional conclusions can be derived from the growing evidence:
1. When measured from the low in 1932 (approximately 55.00), Cycle wave-1 and SuperCycle wave (I) (ending 1835) relate to each other by 61.8% in price and time. This development is very interesting when it is considered that the historical prediction for the time and price beginning of the 200-plus year advance was concluded independently of this fact.
2. The corrections that follow the larger and the smaller first waves are both Flat corrections.
3. The two large corrective advances, one from 1860 to 1929 and the other from 1974 to 1987(?), are both Double Zigzag patterns (see Figure 5). Since the larger advance from 1860 was a Cycle degree X-wave, it is only logical to assume that the pattern from 1974 to 1987 would be an X-wave of Primary degree (one degree lower than Cycle). As in 1929, the 1987 high is only part of a larger second wave.
4. Implementing the 61.8% ratio again, this time to the 21-year Triangle, we can assume that a 13-year contraction started October 1987 (21 x .618).
5. The maximum extent of the correction, which began in October 1987, is limited to the 1932 percentage retracement of the previous Cycle X-wave (1860-1929). That retracement value was about 50%. Taking 50% of the advance from 1974 to 1987, a level of approximately 1640 is indicated on the Dow. Since the low the day after the 1987 crash was 1706 (very close to 1640), there is good reason to believe that the 1987 crash low is the corollary to the 1932 bottom. It cannot be ruled out that the crash low may be exceeded. If so, it should not be broken by more than 100 Dow points.
6. Measuring the advance for SuperCycle wave (I), calculating 61.8%, and adding that amount to the end of SuperCycle wave (I), you arrive at precisely the 1929 top (see Figure 5). This is a very typical stopping point for an X-wave in a Double-Three Running Correction. Checking the length of Cycle wave-1 (1949 to 1966), multiplying by the fraction .618, and adding that amount to the top of Cycle 1 puts you exactly at the 1987 high.
The fact that multiple measurements, when applied to wave segments of one lower degree, produce the same results is beyond coincidence. There is no doubt that Cycle wave-1 and wave-2 are, so far, mimicking the action of SuperCycle waves (I) and (II).
CONCLUSIONS
The inherent power of a 115-year “Running Double-Three Correction” (SuperCycle wave (II), 1949) has astounding implications for the future. This allows us to arrive at a resolution on the most probable market and economic activity for the next 70 years:
1. The economic contraction which started in October 1987 will be of ONE LOWER magnitude in severity than the Depression of 1932. Why? The Cycle 2-wave currently in progress is of one lower degree than the correction in 1932. As the market moves sideward for the next 13 years, economic conditions should gradually improve as they did from 1932 to 1949.
2. SuperCycle wave (III) is going to be the Extended wave of the Impulse pattern (see Figure 6). In other words, SuperCycle wave (III) will be much longer than SuperCycle wave (I). This means the U.S. market, right after the turn of this century, should begin to advance again. This advance should last for decades, creating the biggest bull market of all time (see Figure 6). The minimum expectation for an Extended wave is 161.8% of the previous Impulse wave of the same degree. Measuring the length of SuperCycle wave (I), calculating the above ratio, and adding the product to the end of SuperCycle wave (II) (1949) produces the incredible, minimum target of (you’d better sit down) over 100,000 basis the Dow. By applying time techniques to the Wave structure, that price level should not be achieved any earlier than the year 2020, and no later than 2060!
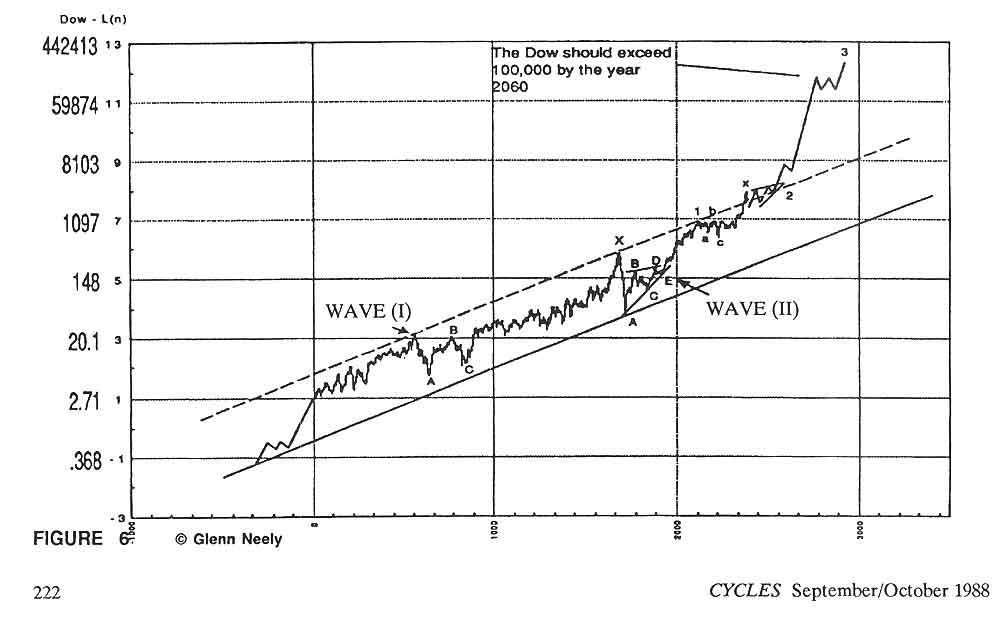
The seeds are currently being sown for an international boom of unprecedented proportions. Over the next few decades, the majority of third world countries should have become industrialized. This will bring dramatic improvements in the standard of living for all citizens of such countries. International competition should invoke jealousy and a “keep up with the Joneses” mentality, forcing such communist countries as Russia to move toward a more productive, capitalistic economy.
FUNDAMENTAL JUSTIFICATION AND COMMENTS
After the year 2000, the world should begin moving into the most optimistic period ever experienced. This psychology should be in full swing by the year 2050. Toward the middle of the next century, there should be a virtual lack of wars, famines, depression, etc. – a sustained period of prosperity and peace.
For those of you who find a 100,000 Dow incomprehensible, consider that the market, from my predicted low of 0.30 up to the 1987 high of approximately 2700, has increased in value almost one million percent in a little over 200 years. A move from 2700 to 100,000 is only 4900%. The analysis allows 70 years for this to take place. Thus, a move to 100,000 in 70 years is highly plausible in comparison to the historical record.
I realize the conclusions outlined in this article characterize a near utopian society; but remember, all conclusions are based on what the Wave Theory virtually “guarantees” will be the most incredible economic period of all time. The latter (conclusions) is logically derived from the former (analysis).
ARTICLE SOURCES
- Glenn Neely, “The Future Course of the U.S. Stock Market, An Elliott Wave Viewpoint“, Foundation for the Study of Cycles, September/October, 1988, 217-233.
For a printed version of this article, you can find it in the Appendix of Glenn Neely’s book, Mastering Elliott Wave. The Appendix is titled “Stock Market Forecast to the Year 2060”. The book was published by Windsor Books in 1990 and is still in print. Pick up the book if you are interested in learning more about new discoveries going beyond R.N. Elliott’s principles. Learn more about Glenn Neely at Neowave.com
Mastering Elliott Wave
Presenting the Neely Method: The First Scientific, Objective Approach to Market Forecasting with the Elliott Wave Theory (version 2)
by Glenn Neely (author) and Eric Hall (author)

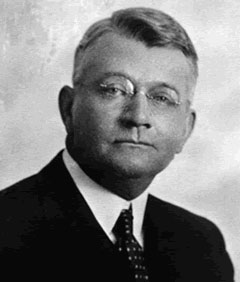
“The market has advanced and declined on the same kind of news. Therefore, the only way to ‘see the forest clearly’ is to take a position above the surrounding trees.”
Ralph Nelson Elliott
Founder of Elliott Wave Principle

Are you feeling confident?
What patterns are you seeing in your market forecast? Keep asking questions and don’t stop learning…
